In Vivo
From design to readout, the whole animal study runs in Affinity
Affinity's In Vivo module runs the whole animal study in one place, with the study scoped to its project and test article, the cohort enrolled into treatment groups and dosed against a reagent in the bioregistry, measurements and mortality and tissue collection captured on schedule as the study runs. When the data is in, the study reads out where it was run: survival curves, per-group time-series, and dose-response fits, against the same cohort the technicians dosed, not a spreadsheet re-typed into an analysis tool once the study ends.
A live animal study is hard to keep in a spreadsheet
An in vivo study has a lot of moving parts. Treatment groups each get their own dosing schedule. Dozens of subjects are tracked individually and measured on a schedule for weeks. Mortality events have to be recorded as they happen. Tissue samples get collected at terminal time points and need to land in the freezer with their donor and anatomical region attached. And the readout has to tie back to the same subjects, whether survival curves, time-series of body weight or tumor volume, or dose-response fits for treatment efficacy.
Teams that keep this information in a stack of spreadsheets and paper notebooks and then re-enter it into an analysis tool lose the critical links. The spreadsheet loses the link between a tumor volume reading and the subject's treatment group; the analysis tool doesn't know which animal donated which tissue; the study's project context lives in someone's head. Affinity treats the study as a single tracked object: subjects enrolled in their treatment groups, doses recorded against the live cohort, measurements landing on schedule, tissue samples collected with their donor lineage attached, and the analysis tab running against the same data the study generated.
Click here to download the StackWave Affinity LIMS presentation
A new study takes shape
The program needs an efficacy study for the lead anti-CD20 candidate in a CD20-positive lymphoma xenograft. Tumor cells are implanted in immunodeficient mice and left to engraft; once the tumors reach a target volume of roughly 100–150 mm³, the mice are randomized into four groups of ten: a vehicle control and three escalating dose levels. Dosing starts, and over the next three weeks, tumor volume and body weight are measured twice a week, with tissues collected at the endpoint.
Setting the study up is mostly saying what it's part of and who's in it. The study scopes to its project and the test articles the cohort will receive, anchored to a zero day the rest of the timeline counts from. Its treatment groups go in as vehicle, low, mid, high, with each tied to the batches it will be dosed with, so the dosing plan is part of the study rather than a separate protocol. Then the cohort enrolls in one pass, with forty animals entered together all at once instead of one form forty times, each animal assigned to its group. From that point on, the study holds the whole design in one place: the groups, the animals, the doses each group gets, and the program the work serves.
The cohort gets dosed
The animals are housed, the dosing protocol is approved, and the first dose is due.
Dosing is recorded against the live cohort, not a separate ledger: the dose lands on the actual subjects in their groups, drawn from the same batches the groups were already tied to. Nothing needs to be copied between a protocol document and the
study record because the dose is already a part of the record. Each animal's dosing history builds as the doses go out, and an animal moved between arms over the course of the study carries both treatments on its record, so a crossover is visible at a glance rather than reconstructed later.
Measurements come in on schedule
The cohort is dosed and the study is running. Body weight and tumor volume are due twice a week, and the technicians need the readings to land in the right rows fast.
Measurements come in the way they're taken at the cage rack: in bulk. Select a date and the form for the required measurements on each animal appears based on the study schedule, or download a spreadsheet template for the day's operations and upload it back to Affinity. Deaths are logged as they happen, with cause, so the cohort's attrition is current the moment it's known instead of reconciled at the end. The unusual one-off read still works one animal at a time, but the schedule is built for throughput. The observations that surround those numbers, the clinical signs and protocol notes recorded through the study, are written up in the lab notebook, kept in the same platform as the structured record rather than a separate binder.
Tissue samples land in inventory with their donor lineage
The terminal time point arrives. Tissues from the animals need to land in the freezer with their donors and anatomical sites attached.
The harvest is donor-linked from the first entry. Each tissue comes in associated with the animal it came from and where on the animal it was taken, entered in bulk so a thirty-animal harvest is one submission, not thirty forms, all of which drops into the freezer at the end. The donor link connects a tissue back to its subject, that subject's group, and the study that produced it, and each animal's record lists every tissue taken from it, so the bank in the freezer and the cohort from the study never drift apart.
The study reads out
The dosing window has closed, the measurements are in, the tissues are banked, and the question now is what the study showed.
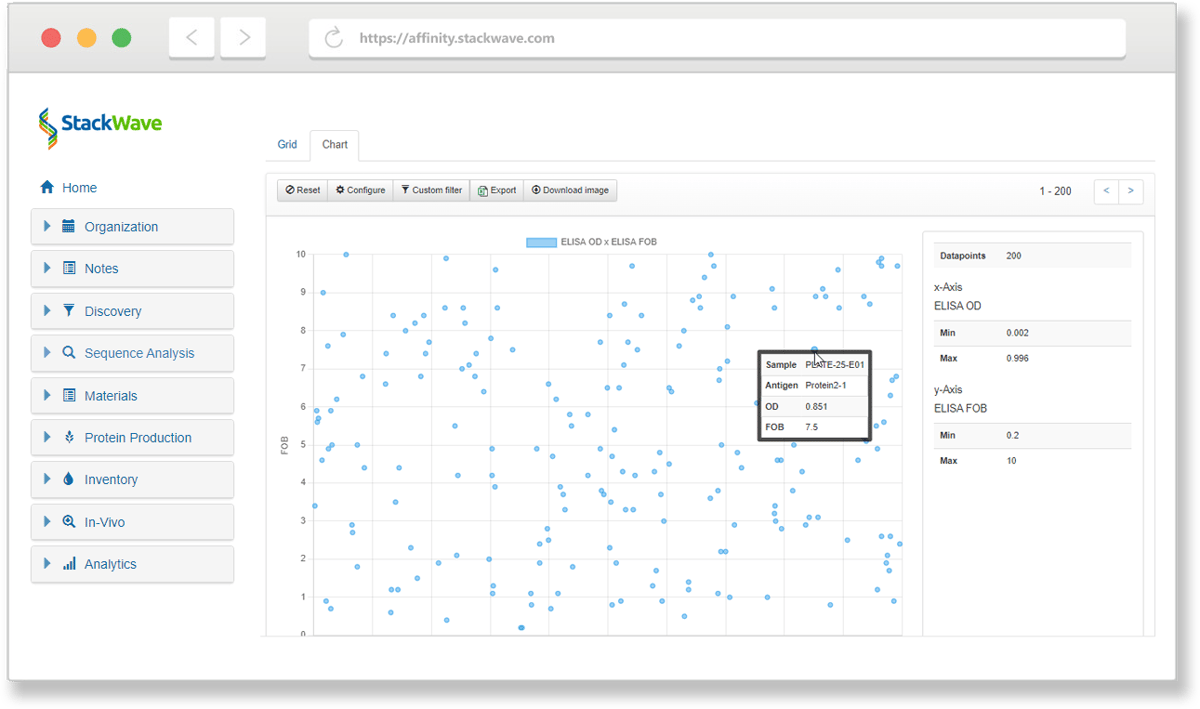
The study reads out where it ran, against the same records the technicians produced, not a re-typed spreadsheet. Mortality becomes a survival curve per group, so the arms' attrition stacks up side by side. The scheduled measurements of tumor volume and body weight become per-group trajectories on a built-in plot, with assay data from the harvested tissues available as well. And when the study was built as a dose range, the effective or inhibitory dose can be computed with a dose-response fit. The picture that goes into the program review is the study itself, not a copy of it.
How In Vivo connects to the rest of Affinity
-
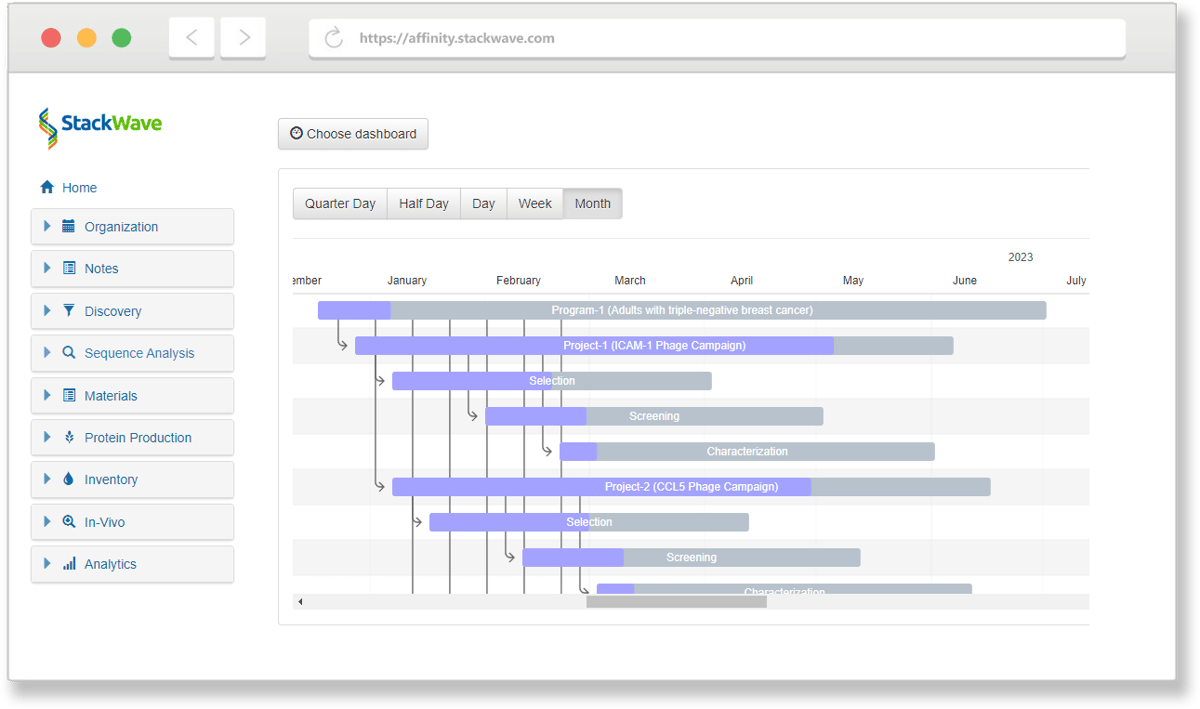
Planning is upstream. Every study scopes to a project, and the project carries the program context — its target, modality, and decision history — into the study from the start.
-
Bioregistry is where the test articles live. The therapeutic batches a treatment group is dosed with are records in the bioregistry; the dose link traces back to the specific lot the cohort received.
-
Inventory holds the tissue samples once they're collected. Tissues land as first-class inventory records, with their donor and anatomical region attached for the lifetime of the sample.
-
Analysis is where the study's data gets turned into results. Survival analysis, operations time-series, and the pipeline for ED50 and ID50 dose-response fits all run against the study's recorded data.
-
Discovery is a separate but related workflow. Immunization studies that feed hybridoma discovery live on the Discovery surface when the Immunizations module is enabled; the In Vivo module covers the downstream PK, PD, and efficacy work.
Why choose Affinity for in vivo
-
The study is a tracked object, not a folder of spreadsheets. Subjects, treatment groups, dosing batches, measurements, mortality, tissue samples, and the analysis readout all live on one study record.
-
Bulk in, bulk out. Subject enrollment, tissue collection, and scheduled measurements all support bulk entry, so a forty-eight-animal cohort or a thirty-animal terminal harvest is one submission rather than thirty.
-
Analysis runs against the study's own data. Survival curves, time-series operations comparisons, and ED50 / ID50 dose-response fits use the cohort's recorded measurements directly — no export to a separate analysis tool.
-
Transparent pricing. $175 per user per month, every module included — including In Vivo.
-
Founded in 2011, focused exclusively on biologics R&D — the in vivo workflow built alongside the discovery and protein production workflows it sits between.
Manage your entire process, from discovery to lead characterization
With Affinity, it's never been easier to collaborate effectively on drug discovery and development. Spend more of your time on discovery instead of data entry by using one solution that provides all of the tools you'll need. Request a demo or free trial today.
Collaborate
Facilitate collaboration between discovery, production, and analytics teams
Integrate
Fully integrated, from target identification to lead characterization
Consolidate
Single source of truth for all assay data
Analyze
In-depth analysis of lead antibodies
Learn more about our solutions for Biologics R&D
-
Sequence Analysis
-
Phage Panning
-
Lead Characterization
-
Hybridoma Production
Sequence Analysis
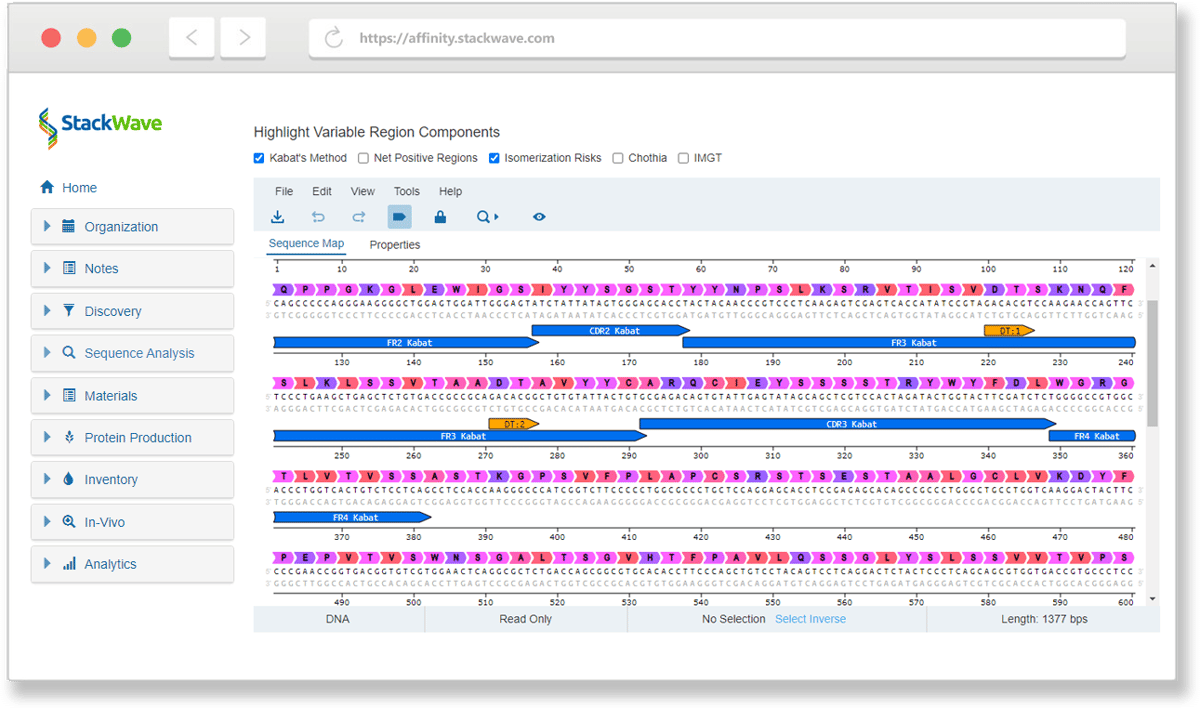
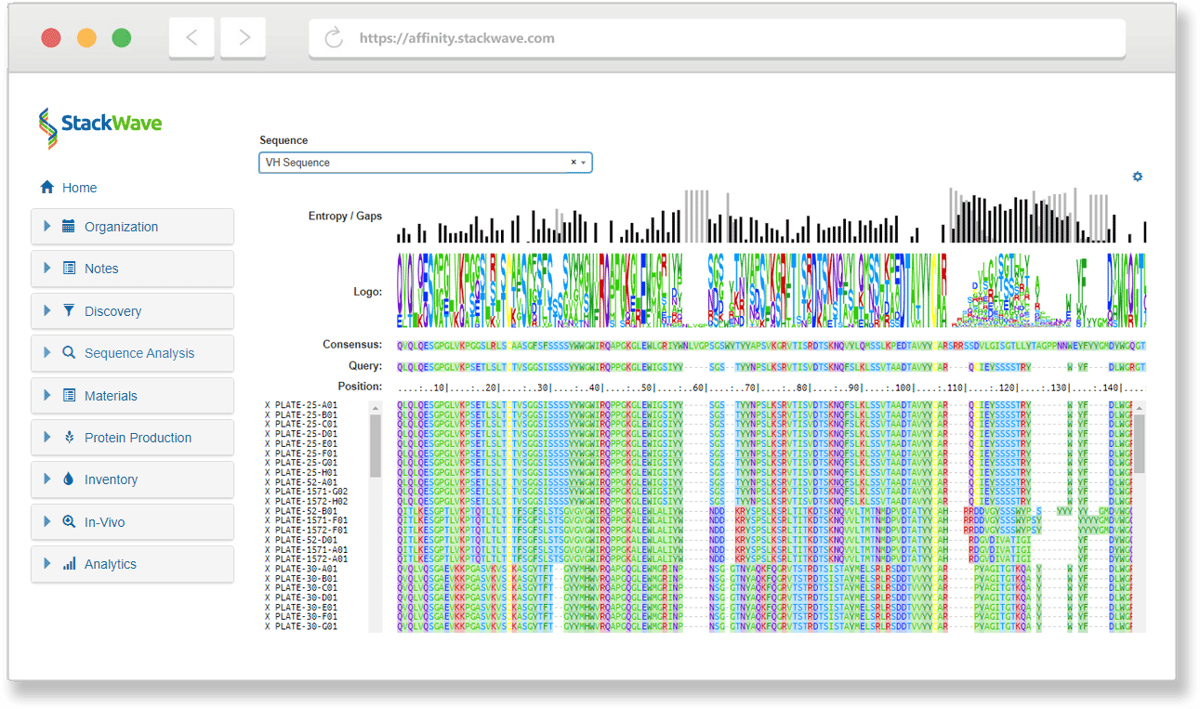
Leverage Affinity’s built-in sequence analysis tools to identify the unique antibodies in your discovery campaign results without having to license or build a separate bioinformatics system. Additional sequence search tools take advantage of Affinity’s sequence and variable region databases to quickly find related sequences.
Phage Panning
Phage panning allows you to narrow the enormous diversity represented by your phage libraries to a manageable set of antibodies for further study. Create visual designs of your phage panning experiment to track which combinations of antigens and other inputs produced the most promising leads. From the pools of phage output produced, generate sets of screening plates for assaying, sequencing, screening, and analysis.
Lead Characterization
StackWave Affinity provides workflows for phage, hybridoma, and single B-cell campaigns, assay data management, sequence analysis, custom reporting, and plate generation in a single solution. These tools integrate seamlessly to help discovery teams quickly identify their most promising lead antibodies. Automation support for liquid handling platforms and assay data ingest allows for high-throughput screening of campaign results.
Hybridoma Production
Manage the complexity of hybridoma campaigns with an actual animal study management solution that connects seamlessly with hybridoma plate generation. Generated plates can be screened, sequenced, filtered, and lead antibodies identified using an intuitive set of tools that combine assay data management, sequence analysis, and custom reporting.
"StackWave gives us confidence in our leads by collecting all of the data about our potential therapeutics in one place and making that data actionable by allowing us to compare antibodies of interest."
"I worked with StackWave for ~4 years at my previous job to implement our LIMS. It was a great learning experience. We put in place an incredible system for our entire workflow, from plasmid registration to in-vivo study data registration."
"StackWave’s Platform allowed us to collaborate on our in-vivo studies in a web browser at home... I would highly recommend StackWave for therapeutic discovery teams looking to improve collaboration between teams."