StackWave Affinity™

 Inventory

Where is it. How much is left. Who has it.

A live picture of every freezer, shelf, rack, box, and tube in your lab, and every aliquot inside them, all tied to the experiments those samples are part of. Scientists pull samples without hunting for them. Lab managers see what's on hand without opening a spreadsheet. And the assays, clones, and proteins that come out of those samples keep their full history.

StackWave Affinity™ Inventory Module

Two problems, one place

Inventory in a biologics lab is two problems stacked on top of each other. The first is the warehousing problem: labs comprise hundreds or thousands of plates, tubes, and vials, stored in a nest of freezers, shelves, racks, and boxes, all moving around as samples are placed, retrieved, used up, and reshuffled. The second is the scientific lineage problem: the vial you just pulled isn't only a unit of stock. It's a plasmid built from a specific lot, expressed in a specific host, characterized by a specific assay, and selected for a specific program.

An inventory tool might handle the first problem but lose the second one the moment a sample leaves the freezer. Affinity's Inventory module covers both. The storage picture and the scientific history live in the same place, so they never drift.


Click here to download the StackWave Affinity LIMS presentation

A scientist's day, in Affinity

A shipment arrives

The package from your vendor shows up at the loading dock. Three vials of antibody Ab-1042, 1 mL each at 5 mg/mL. Vendor lot number A1042-0823.

In Affinity, the lot is recorded once by specifying the vendor and its lot number, then the three vials are placed into their freezer positions. From there, it's first-class: every assay that pulls one of those vials, every clone made from one, every protein expressed from one, all ties back to this shipment. For plasmid lots, a built-in sequence check confirms the vendor-shipped sequence matches the expected vector before it goes in the freezer.

You make something at the bench

You finish a plasmid prep, or an expression run, or a tissue harvest from an animal study. The new sample shows up in Affinity automatically; the workflow that produced it puts it there.

A plasmid construction produces a plasmid sample with its prep size and recovered DNA captured alongside. An expression run produces a protein sample with its transfection volume and yield. A tissue harvest produces a tissue sample with the study and project it came from. You don't have to register in-house samples by hand; the work that produces them is the registration.

You go find a sample

You need a vial of Ab-1042 for tomorrow's ELISA.

A search turns up the vial and shows its location as a path you can follow, from freezer to shelf to box to slot, and at a click you've navigated straight to the box in inventory. Pull the vial.

The sample's own record carries the full picture: the antibody's isotype, the vendor lot it came from, the assays it's been part of, the samples it was derived from, the samples derived from it. Library samples show transformant counts and links out to their Sanger and NGS profiling runs. Clone samples carry the lineage of the hybridoma fusion or single-B-cell event they trace back to. Tissue samples link back to the in-vivo study in which they were collected. The list of samples isn't "1.5 mL tube #4711" — it's the molecule, its history, and where to find it.

A vial leaves the lab

A collaborator needs a vial of Ab-1042. You pack it and ship it.

Checking the vial out records who has it, when it left, and why; when it comes back, checking it in captures the updated volume so the stock count reflects what actually returned. The same flow covers shared instruments, off-site analyses, and any time a container leaves the freezer for more than a few hours.

You need to know what's on hand

The next antibody order is in two weeks. The lab manager wants to know whether to reorder Ab-1042 now or wait.

The inventory report answers it directly: stock rolled up by reagent, expandable from each reagent to its lots to the individual aliquots, with total volume and amount at every level. The Ab-1042 row shows exactly how much is left and where each vial sits, and a team that organizes stock by program or customer rather than by molecule can roll the totals up that way instead.

The lab gets rearranged

You added a new -80 °C freezer last month and you're moving samples around to make room.

The inventory browser shows the lab's whole layout, arranged as you would expect to find them: rooms or areas, then freezers and fridges, then shelves, racks, and boxes, and finally the labware that lives in each. Rearranging it is direct: drag a rack to another shelf, add a shelf to the new freezer, drop the boxes onto it. Affinity refuses moves that don't make physical sense (a freezer can't go inside a box), and every sample's location trail and every report updates the moment the move is saved.
How Inventory connects to the rest of Affinity

  • Bioregistry holds the materials that lots and samples reference. A material can have many lots, each with many aliquots, each in a specific container.

  • Molecular Biology sends new plasmid samples into Inventory the moment construction finishes.

  • Protein Production sends new protein samples into Inventory with transfection volume and yield captured alongside.

  • In Vivo sends new tissue samples into Inventory with study and project links back to their source.

  • Analysis reads from Inventory: every assay attaches to a specific sample in a specific container.

  • Reporting reads from Inventory: dashboards roll up containers, samples, and stock levels next to the rest of the program's data.

Why choose Affinity for inventory

  • Built for biologics, not retrofitted. Each kind of sample (an antibody, a plasmid, a clone, a tissue) carries the information a scientist expects to see for that kind of reagent, with no two-step lookup and no custom configuration.

  • One platform, not five. Inventory lives next to discovery, expression, characterization, and reporting in the same system. No integration project, no data drift.

  • Transparent pricing. $175 per user per month, every module included. No add-on fee for inventory.

  • Try it before you buy it. The 14-day free trial includes Inventory at the same depth as the paid tier.

  • Founded in 2011, focused exclusively on biologics R&D — over a decade talking to scientists about their workflows.

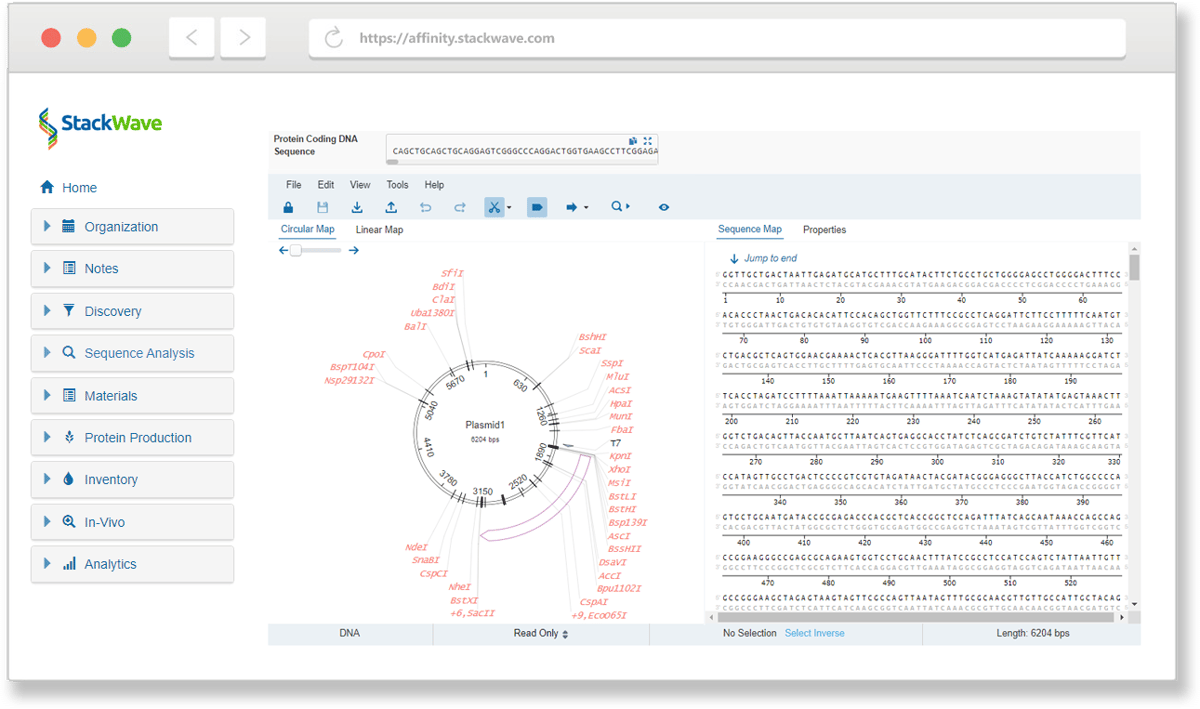
Image of plasmid circular map with restriction sites
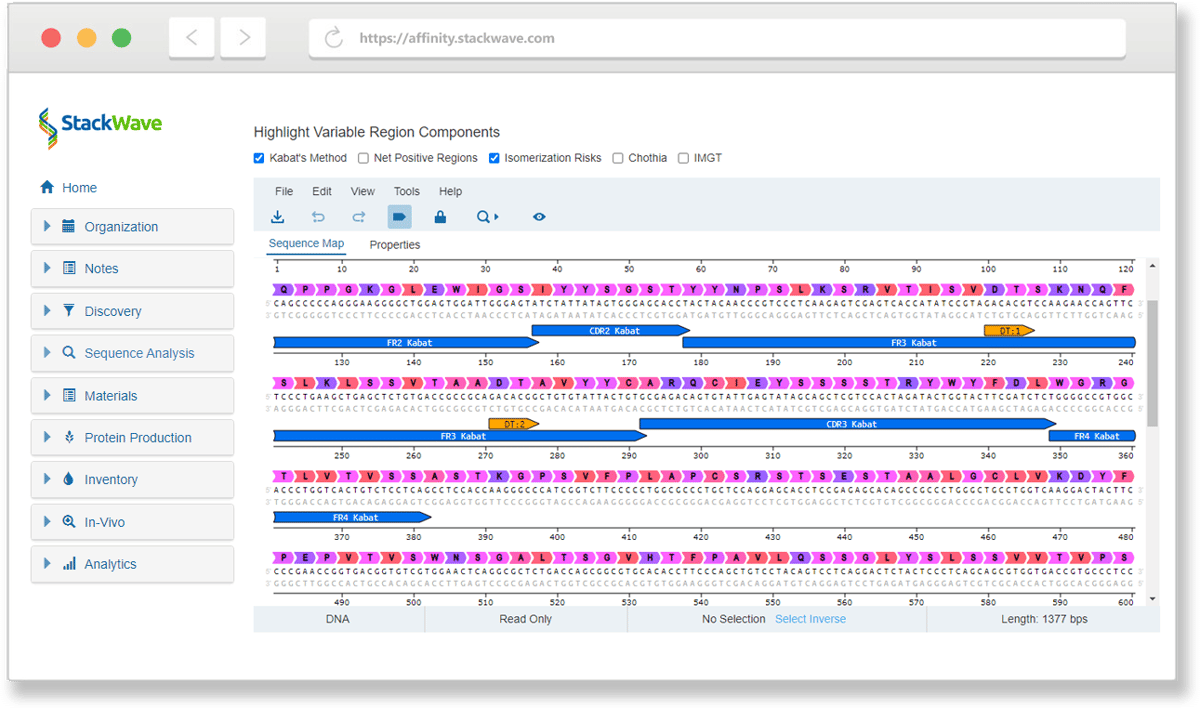
Image of antibody sequence regions
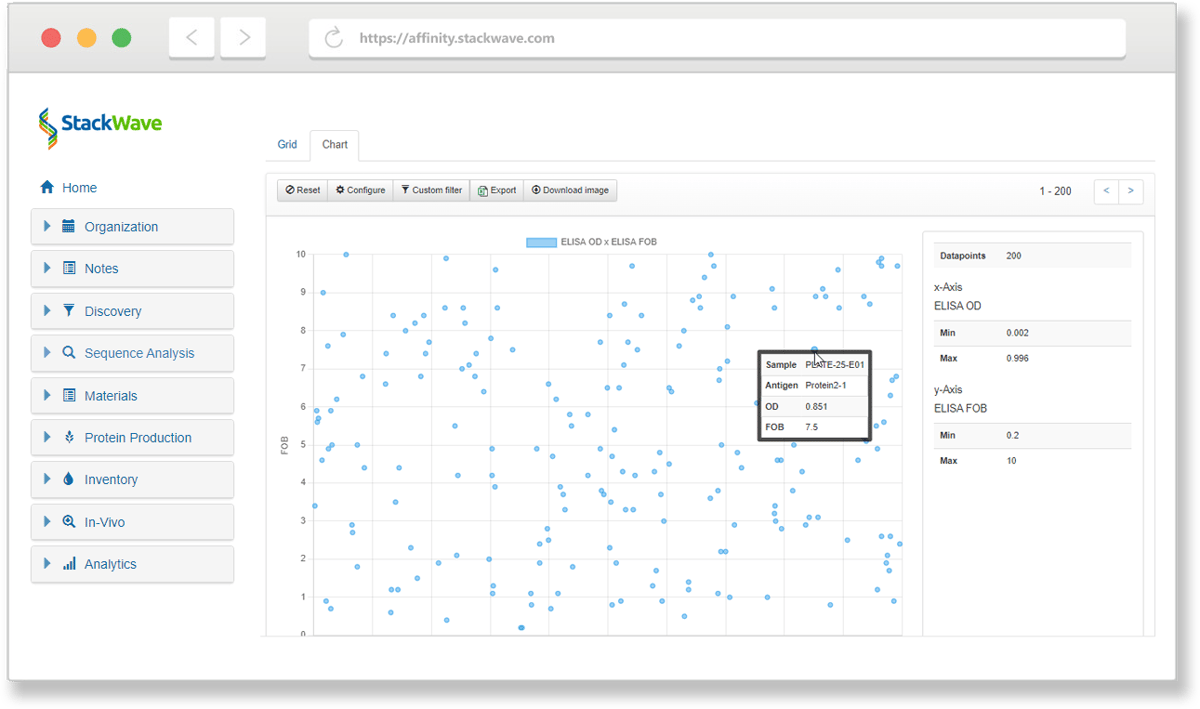
Image of clone lead identification plot
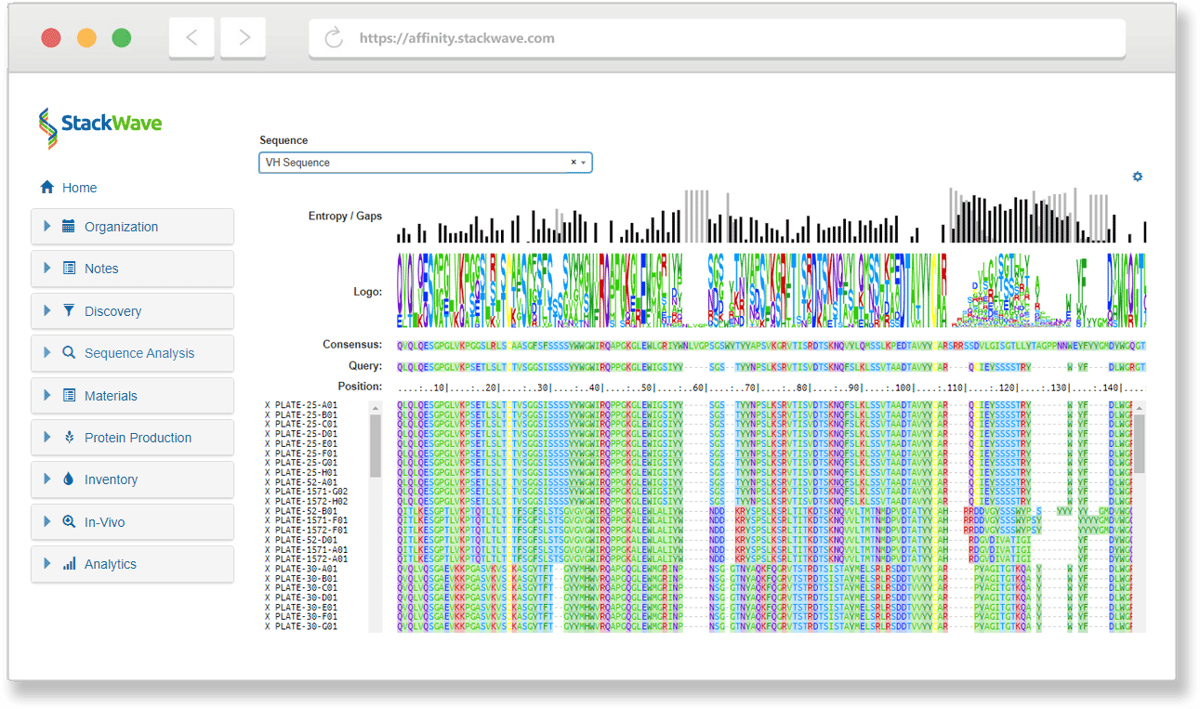
Image of sequence alignment for antibody region
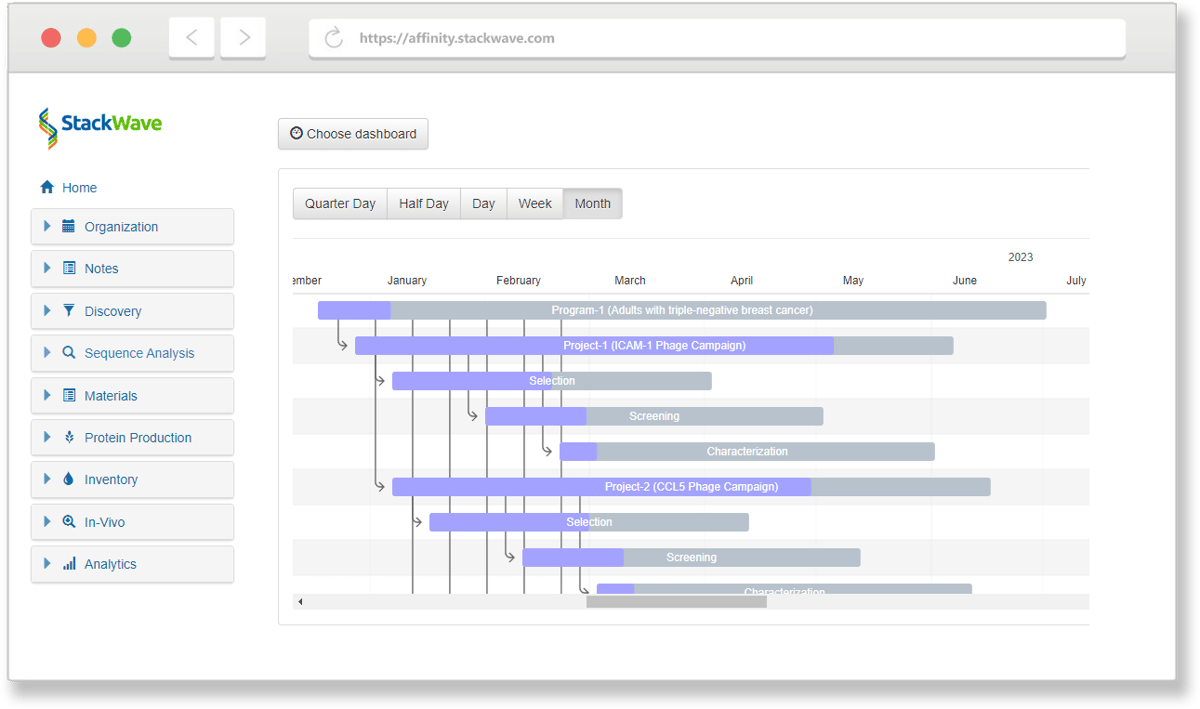
Image of operational antibody project data
Affinity in Action

Manage your entire process, from discovery to lead characterization

With Affinity, it's never been easier to collaborate effectively on drug discovery and development. Spend more of your time on discovery instead of data entry by using one solution that provides all of the tools you'll need. Request a demo or free trial today.

Collaborate

Facilitate collaboration between discovery, production, and analytics teams

Integrate

Fully integrated, from target identification to lead characterization

Consolidate

Single source of truth for all assay data

Analyze

In-depth analysis of lead antibodies

OPTIMIZE YOUR PROCESS

Learn more about our solutions for Biologics R&D

  • Sequence Analysis

  • Phage Panning

  • Lead Characterization

  • Hybridoma Production

Sequence Analysis

Leverage Affinity’s built-in sequence analysis tools to identify the unique antibodies in your discovery campaign results without having to license or build a separate bioinformatics system. Additional sequence search tools take advantage of Affinity’s sequence and variable region databases to quickly find related sequences.

Phage Panning

Phage panning allows you to narrow the enormous diversity represented by your phage libraries to a manageable set of antibodies for further study. Create visual designs of your phage panning experiment to track which combinations of antigens and other inputs produced the most promising leads. From the pools of phage output produced, generate sets of screening plates for assaying, sequencing, screening, and analysis.

Lead Characterization

StackWave Affinity provides workflows for phage, hybridoma, and single B-cell campaigns, assay data management, sequence analysis, custom reporting, and plate generation in a single solution. These tools integrate seamlessly to help discovery teams quickly identify their most promising lead antibodies. Automation support for liquid handling platforms and assay data ingest allows for high-throughput screening of campaign results.

Hybridoma Production

Manage the complexity of hybridoma campaigns with an actual animal study management solution that connects seamlessly with hybridoma plate generation. Generated plates can be screened, sequenced, filtered, and lead antibodies identified using an intuitive set of tools that combine assay data management, sequence analysis, and custom reporting.

"StackWave gives us confidence in our leads by collecting all of the data about our potential therapeutics in one place and making that data actionable by allowing us to compare antibodies of interest."

"I worked with StackWave for ~4 years at my previous job to implement our LIMS. It was a great learning experience. We put in place an incredible system for our entire workflow, from plasmid registration to in-vivo study data registration."

"StackWave’s Platform allowed us to collaborate on our in-vivo studies in a web browser at home... I would highly recommend StackWave for therapeutic discovery teams looking to improve collaboration between teams."

Get started now

One Tool for Biologics R&D