Analysis
Curve fitting, sequence annotation, and NGS analysis, built into the platform instead of exported to separate tools
A biologics program produces data without pause: assay plates off the reader, sequencing runs back from the DNA sequencer, a repertoire returned from an NGS core. Affinity's Analysis module turns that raw output into structured, comparable results. Instrument files import as results tied to the candidate they measured, dose-response curves and statistics compute inside the experiment workspace, antibody sequences are annotated and screened for liabilities as they register, and repertoire runs resolve into the handful of clones worth expressing. The numbers a program acts on are produced where the rest of the data lives, not in a separate tool requiring ongoing import and export.
Analysis is where raw data becomes results
The hard part usually isn't producing the data; it's that the analysis of it happens somewhere else. The plate reader's output goes into one tool, the sequences into another, and the fitted numbers and called domains must be made to fit into the system of record, if they're brought back in at all. At each step, the lineage between a result and the raw data behind it can thin out or be lost entirely.
Plenty of solutions handle data capture but stop short of analysis. Scientists export to other tools, or to Excel, or to a separate bioinformatics system, then are left to re-enter their conclusions, hopefully with the aid of automation and an API, but perhaps by hand or not at all. An ELN-first platform might handle sequence editing but bolt assay analytics on as an integration. Affinity treats all of its computations as a first-class part of the platform: data capture, curve fitting, annotation, liability screening, and clone identification all run within and against the same registry the rest of the platform uses, with no separate license required.
Click here to download the StackWave Affinity LIMS presentation
Plate data lands and the analysis runs
The last selection round handed back a panel of candidate antibodies, and the binding ELISA that ranks them just came off the plate reader. Each candidate is titrated across an eight-point dilution series, with control wells for background and a positive control. Ranking the panel means turning each candidate's dilution series into a dose-response curve and reading its EC50, with every EC50 tied back to the antibody it came from.
The reader's export drops into Affinity as structured results. Its file format is recognized and parsed into a table, so the optical densities arrive already mapped to their wells and tied to the candidates loaded on the plate. No script to program and run, no manual data entry to perform, no separate step to say which well held which antibody.
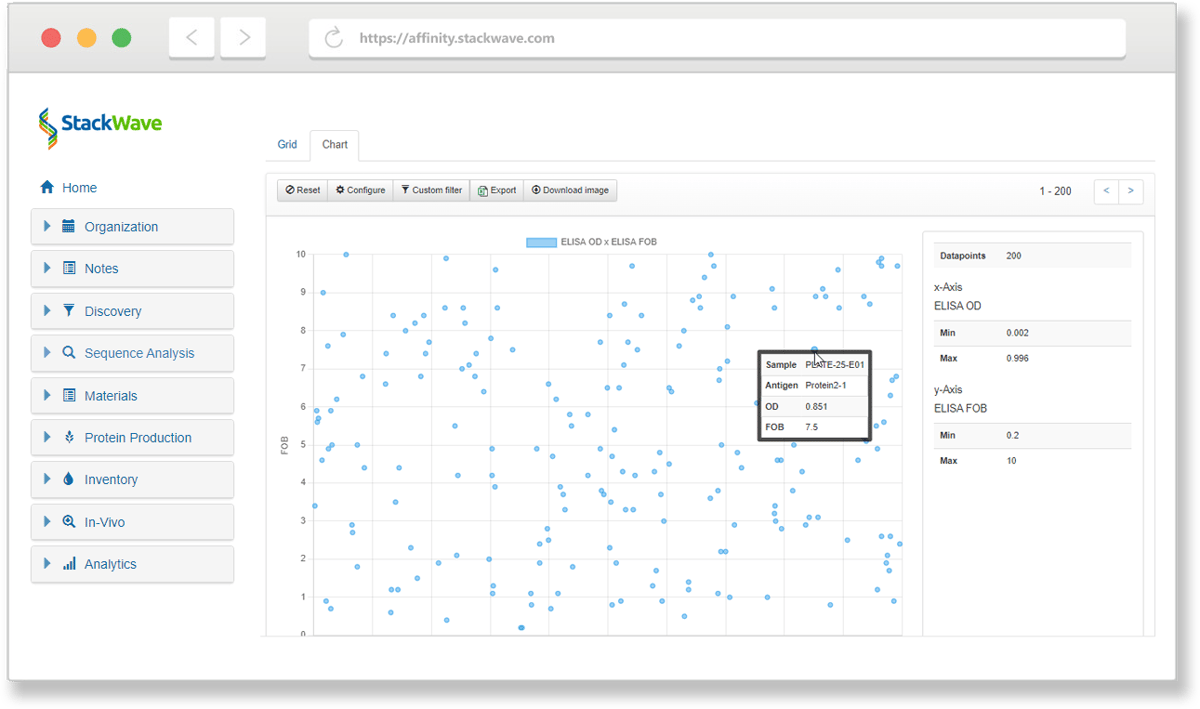
The scientist applies a plate template to label the wells against the plate map, delineating candidate wells from controls, and Affinity works the plate from there: replicates averaged, signal normalized against the controls, and each candidate's series fit to a dose- response curve, with the EC50 falling out of each fit and the curves that misbehaved flagged rather than buried. Every step writes a new dataset instead of overwriting the last, so trying a tighter normalization or masking a stray point branches off the original rather than destroying it. The plates reads become a column of comparable potencies attached to the right molecules, and the decision of which antibodies to advance picks up from there.
You annotate and screen an antibody's sequence
A candidate antibody's sequence arrives, and before anyone commits expression slots to it, there are two questions. What is it: which V, D, and J germlines it came from, and where the framework and CDR boundaries fall. And will it cause trouble later: the deamidation, oxidation, glycosylation, and charge motifs that sink an otherwise good binder partway through development.
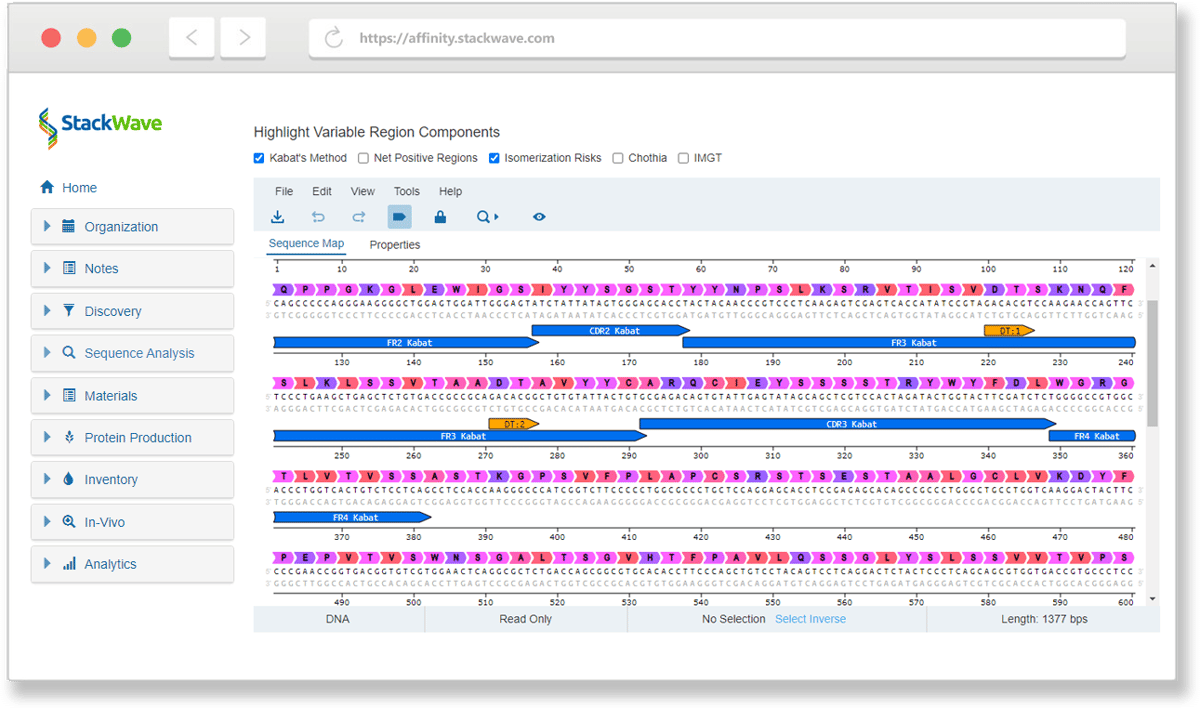
Registering the antibody or sequencing a plate of clones answers both as the sequence data lands. Affinity runs an IgBLAST-based analysis against the germlines you've registered, identifying the variable regions and delineating and numbering their frameworks and CDRs, so that sequences enter the registry as structured information, paired domains with their framework and CDR breakdown. In the same pass, it screens those regions against a set of known (or your custom) sequence-liability patterns and flags what it finds: an N-glycosylation site, a deamidation-prone region, or an unpaired cysteine, each marked by position.
What lands on a clone or antibody's page is a fully annotated variable domain with its liabilities called out, and because those liability counts and CDR properties are the same sequence-derived fields a scoring profile reads, a developability red flag counts against the candidate automatically when the panel is later ranked. The analysis is performed when the sequence is first registered, not as a separate step that someone has to remember to run later.
You identify clones from an NGS run
A repertoire run came back from the sequencer, and the pipeline that annotates it has already done its work, with V(D)J calls made, CDRs delineated, productivity scored, and the whole run written out in standard AIRR format. What's left is the part that decides the outcome: turning a few hundred thousand annotated clonotypes into the handful of clones worth expressing.
That AIRR output is what comes into Affinity. Create an analysis, upload the files, and Affinity organizes the annotated repertoire and makes the run navigable: enrichment, mutation frequency, CDR properties, and built-in sequence alignment to compare across clonotypes. From there, the clone picker is how the scientist builds a working set: narrow to a list of clones, identify the candidates worth taking forward, add them to a set, align them, or send them straight to expression.
You search and align across the registry
Program review is Friday. The work to assemble: every assay result, every called variable domain, every score, every liability flag for the candidates in the top set, all composed into a single view the team can read together rather than a deck rebuilt the night before by exporting from each surface.
Affinity's report builder assembles exactly that. The scientist opens it from any list of candidates — a saved set, a Lots page, the project's dashboard — and the candidates already in scope arrive pre-filtered. Pick the result columns to include (KD from Biacore, EC50 from the ELISA, monomer percent from SEC, Tm from nanoDSF), add the sequence-derived properties (CDR lengths, liability counts, computed protein properties), and the builder composes one row per candidate with every field side by side, sortable by any column and ready to export for the deck or to stay open as the live working surface through the meeting. A companion alignment view runs MUSCLE over the same set's chains, so the structural picture sits one tab away from the numerical one.
When the report needs to outlive one scientist's session, it is saved as a named report with its columns and criteria preserved, ready to re-open the next time a similar review comes around.
You search the registry for a sequence
A reviewer asks whether a CDR3 you're looking at has come up before, perhaps in an earlier campaign, a different program, or a deposited reference. The work is a lookup across everything the team has registered, not a guess from memory.
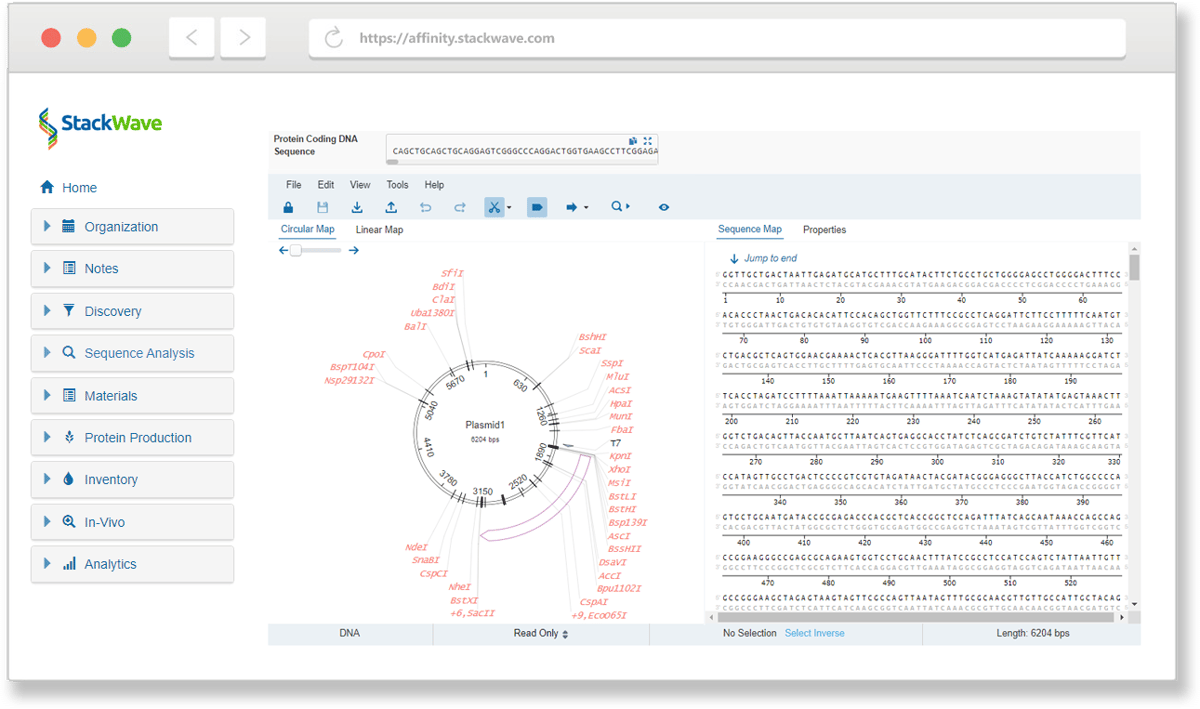
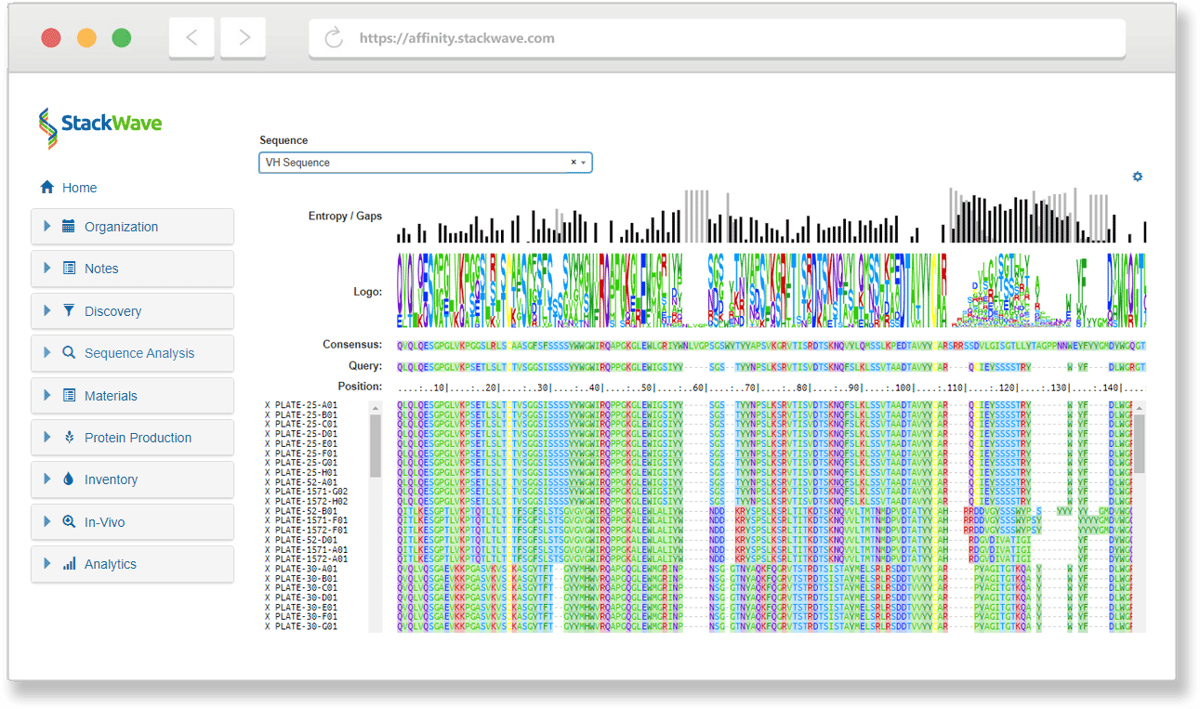
Sequence search is built in: DNA or protein, by exact match or by BLAST, against every registered protein, plasmid, oligonucleotide, and clone, each hit linking back to its source. Alignment works the same way, with sequences picked from the registry by name or pasted as FASTA, aligned by the chosen method, colored by residue against a highlighted reference, and downloaded as aligned FASTA or a rendered image. Translation renders DNA and protein side by side, with FASTA or CSV export. The bioinformatics is part of the platform, not a separate license.
How Analysis connects to the rest of Affinity
-
Bioregistry is what sequence search runs across. Every registered protein, plasmid, oligonucleotide, and clone is reachable from a search hit, and every aligned sequence can be picked from the registry by name.
-
Discovery is upstream and downstream. Discovery campaigns produce the clones whose plate-level binding data feeds the assay results captured here; the clones picked out of an NGS run flow into downstream campaigns and panel reviews carrying their variable-domain annotations.
-
Planning is the program, project, and target structure the work here is scoped to. A fitted result, an annotation, or a clone identification carries its project context, so the work sits inside the program's structure rather than in a disconnected analysis tool.
-
Reporting consumes what Analysis produces. The fitted potencies, annotations, and liability counts computed here are the fields a scoring profile ranks and a cross-candidate report composes; that ranking, dashboard, and reporting layer lives in Reporting, reading the same registry Analysis writes to.
-
Protein Production is downstream of clone identification. Selected clones can be sent to expression directly from a clone set's toolbar.
Why choose Affinity for analysis
- Instrument capture and curve fitting where the data lives. Files from your instruments parse into structured results tied to the candidate they measured; replicates normalize and dose-response curves fit inside the experiment workspace, each step preserved as its own dataset, with no export to a separate curve-fitting tool and no conclusions re-entered by hand.
-
Built-in sequence analysis, not a bolt-on. Sequence Search, BLAST, alignment, and translation run against the same registry the rest of the platform uses; antibody sequences are annotated and screened for liabilities by an IgBLAST-based pipeline as they're registered; and AIRR-annotated repertoire runs load straight into clone-level analysis, with no separate bioinformatics tool to license and no integration to maintain.
-
Transparent pricing. $175 per user per month, every module included — including the bioinformatics tooling that most LIMS price as an add-on or omit entirely.
-
Founded in 2011, focused exclusively on biologics R&D — more than a decade of building the analytical workflow for the scientists who run discovery, expression, and characterization together.
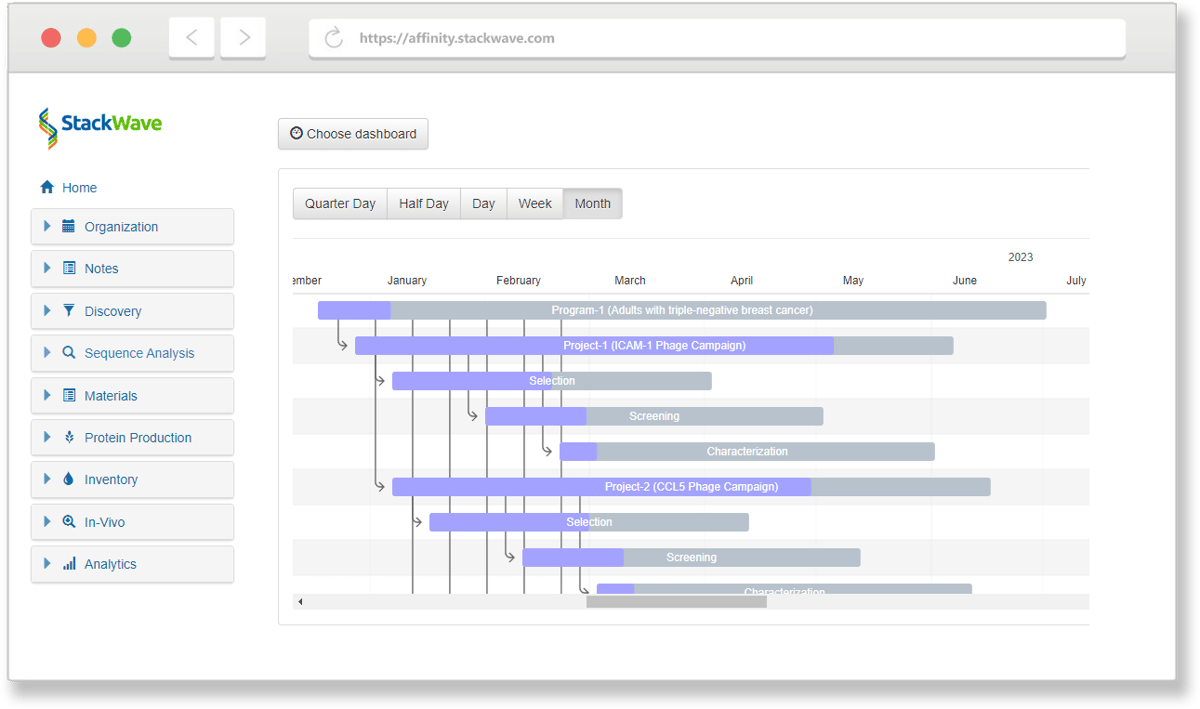
Manage your entire process, from discovery to lead characterization
With Affinity, it's never been easier to collaborate effectively on drug discovery and development. Spend more of your time on discovery instead of data entry by using one solution that provides all of the tools you'll need. Request a demo or free trial today.
Collaborate
Facilitate collaboration between discovery, production, and analytics teams
Integrate
Fully integrated, from target identification to lead characterization
Consolidate
Single source of truth for all assay data
Analyze
In-depth analysis of lead antibodies
Learn more about our solutions for Biologics R&D
-
Sequence Analysis
-
Phage Panning
-
Lead Characterization
-
Hybridoma Production
Sequence Analysis
Leverage Affinity’s built-in sequence analysis tools to identify the unique antibodies in your discovery campaign results without having to license or build a separate bioinformatics system. Additional sequence search tools take advantage of Affinity’s sequence and variable region databases to quickly find related sequences.
Phage Panning
Phage panning allows you to narrow the enormous diversity represented by your phage libraries to a manageable set of antibodies for further study. Create visual designs of your phage panning experiment to track which combinations of antigens and other inputs produced the most promising leads. From the pools of phage output produced, generate sets of screening plates for assaying, sequencing, screening, and analysis.
Lead Characterization
StackWave Affinity provides workflows for phage, hybridoma, and single B-cell campaigns, assay data management, sequence analysis, custom reporting, and plate generation in a single solution. These tools integrate seamlessly to help discovery teams quickly identify their most promising lead antibodies. Automation support for liquid handling platforms and assay data ingest allows for high-throughput screening of campaign results.
Hybridoma Production
Manage the complexity of hybridoma campaigns with an actual animal study management solution that connects seamlessly with hybridoma plate generation. Generated plates can be screened, sequenced, filtered, and lead antibodies identified using an intuitive set of tools that combine assay data management, sequence analysis, and custom reporting.
"StackWave gives us confidence in our leads by collecting all of the data about our potential therapeutics in one place and making that data actionable by allowing us to compare antibodies of interest."
"I worked with StackWave for ~4 years at my previous job to implement our LIMS. It was a great learning experience. We put in place an incredible system for our entire workflow, from plasmid registration to in-vivo study data registration."
"StackWave’s Platform allowed us to collaborate on our in-vivo studies in a web browser at home... I would highly recommend StackWave for therapeutic discovery teams looking to improve collaboration between teams."