Planning
Know what your team is working on, where things stand, and what's coming next
Affinity's Planning module is the structure of your R&D work, connecting your programs (or customers), the projects that comprise them, and the biological targets each project is going after all the way down to the samples, assays, and leads that come out of them. See what teams are working on without chasing email updates, and how each team's work connects to the rest of the organization's efforts. You set the structure once; from there the connections, the timeline, and the candidate rankings keep themselves current as the work happens.
Structure that actually connects to data
A biologics R&D organization runs dozens of projects against dozens of targets across multiple modalities, often for years at a time. Programs accumulate samples, assays, sequence data, and lead candidates as the work moves from target validation through discovery, characterization, and lead selection.
Most planning tools handle the org chart side (programs, projects, who owns what) and stop at the boundary of the science. The science lives in a separate set of tools: ELNs, inventory systems, analysis platforms. When leadership asks "where are we on the anti-CD20 program?", the answer is assembled by hand from email threads, status decks, and Friday updates.
Affinity's Planning module is the org structure for your work, but it lives in the same system as the samples, the assays, and the leads. Click into a project and the panel of antibodies registered under it is right there. Open a target and the antibodies and fusions being developed against it appear with their experimental data attached. Add phases to a project and a live Gantt chart shows the timeline alongside every other project in the program. The org structure and the data structure aren't two different systems, they're two views of the same thing.
Click here to download the StackWave Affinity LIMS presentation
A new program (or customer) kicks off
You're standing up something new: a new therapeutic area for an internal program, or a new client engagement at a CRO. Say it's antibody discovery against a panel of solid-tumor targets.
In Affinity, you open the Programs (or Customers, for CROs) page, and then register all related projects: campaigns pursuing the same disease area or therapeutic class for internal programs, or campaigns and studies being performed for the same customer. Once the program (or customer) exists, you add the projects that belong to it, one per molecule-level effort, each scoped to one or more targets. The work has structure from day one.
Scoping a project to its targets
You're launching an anti-CD20 antibody discovery project under the new oncology program.
On the project's page, add the targets the project pursues. A project isn't limited to one: scope it to a single antigen like CD20, or to several at once, such as CD20 and CD3 for a bispecific program or a panel of antigens for a broader effort. Every antibody developed against any of the project's targets links back to the project automatically. And a target's own page gathers everything being developed against it across the organization, so a target shared by more than one project shows up under each.
You map out the project's timeline
You've scoped the project to CD20. The next question is how the work flows: when target validation wraps, when hit identification begins, when lead optimization is expected to deliver candidates, when IND-enabling work starts.
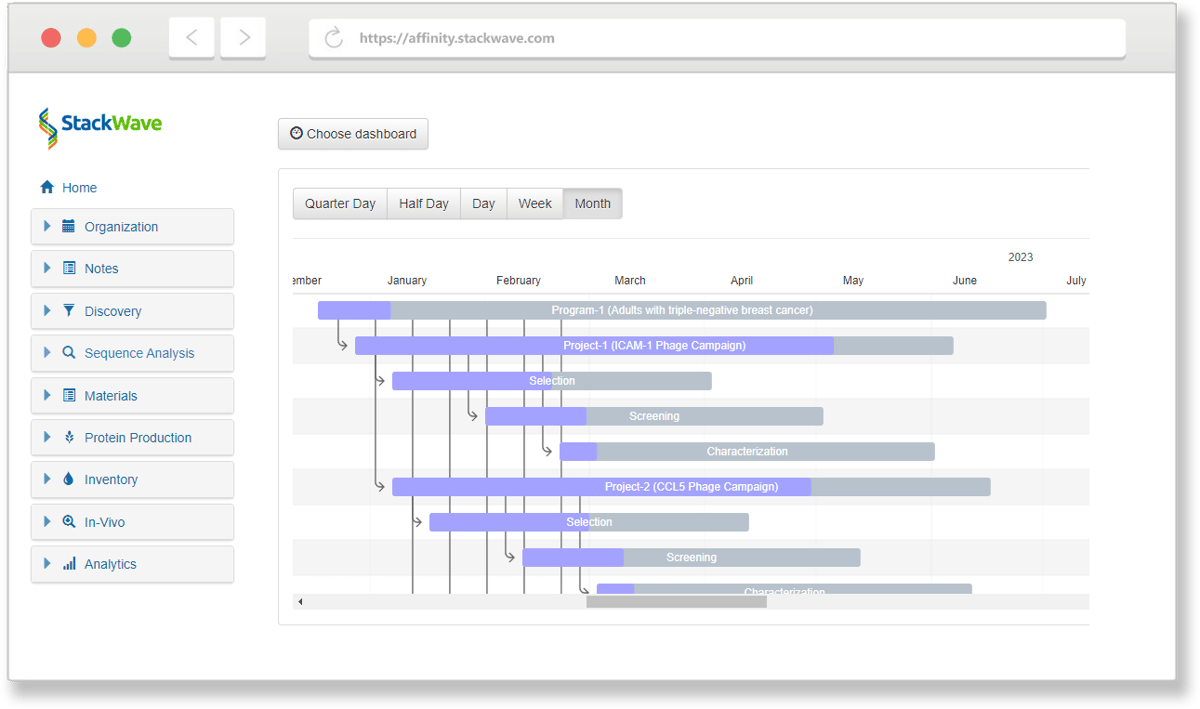
Add phases to the project from its page. Each phase has a name, a start date, and an end date. As phases are added or edited, a live Gantt chart on the project updates immediately. Roll up across the projects in a program and the program-level Gantt shows every project's timeline on a single chart. The program's page becomes the working artifact for status reviews and planning meetings, with no separate project-management tool to keep in sync.
You define what a good candidate looks like
Hits are coming off the anti-CD20 campaign, and the question shifts from "what are we making?" to "which of these is good enough to advance?"
In Affinity, a project's requirements can be captured in a scoring profile, a weighted rubric built from the things that actually decide a biologic's fate: binding affinity from your SPR or BLI runs, developability liabilities flagged in the sequence, protein properties, and more. Each criterion carries a weight, a direction, and the goal value you're aiming for, so the profile encodes this project's definition of success rather than a generic score. Rank for diversity by V-gene family or epitope bin so the leaders aren't ten near-copies of one clone. Profiles are created right from the project's page, already scoped to it, and managed centrally, so a program can hold every project to one bar or let each set its own.
You build the project's dashboard
You want the project's standing visible at a glance, a live read on where the candidates stand against the goals you just set, not a status deck rebuilt every Friday.
Build a dashboard for the project and assemble it from the views that answer that question. A candidate-ranking view scoped to the project puts the strongest leads against the goals you set at the top, with a goal summary showing how the field is tracking; it isn't a list you hand-curate but a set defined dynamically on every candidate in scope, recomputed as the data underneath it changes. Set the project's phases beside it as a live Gantt, add throughput metrics or trends over time, and the schedule and the pipeline sit next to the science on one page. Bind that dashboard to the Home page and it becomes the team's landing view, the same picture for everyone who signs in.
Group work along your own lines
Your work is filed by program, project, and target, and most of the time that's exactly how you want to find it. But now and then you need it grouped a different way entirely, across all of those lines at once, because a set of items belongs together for a reason the structure doesn't hold.
The Tags page lists every tag your organization uses and what's tagged with it. A single tag can apply to programs, projects, targets, and candidates all at once, and filtering by it returns everything that carries it. Tags let you group work along lines your structure doesn't already draw, gathering related items from anywhere in the organization into one view without disturbing how they're organized everywhere else.
How Planning connects to the rest of Affinity
Planning isn't a separate management layer — it's the spine the other modules attach to.
-
Bioregistry links every registered antibody, plasmid, and vector to one or more projects via targets. An antibody registered against CD20 automatically shows up under any project scoped to CD20.
-
Discovery scopes every screening campaign, panning round, and clone selection to a project. The clones that come out are already attributed.
-
Molecular Biology ships new vector constructions into the inventory tagged with the project they were built for.
-
Protein Production captures expression runs against the project that requested the protein.
-
Analysis scopes every assay result, every scoring run, and every comparison to the project context in which it was run.
-
Reporting supplies the dashboards that bind to the Home page and roll up program and project standing automatically as work progresses, including the candidate-ranking views that apply each project's scoring profile.
The result is that the project context isn't manually maintained. Once the structure is set, every downstream workflow inherits it.
Why choose Affinity for planning
-
Structure connected to data, not parallel to it. The org chart and the experimental data live in the same system, so the answer to "what's the status of this program?" is one query away.
-
One platform, not five. Programs, projects, targets, and the data they accumulate share the same system. No status decks compiled by hand. No reconciliation between the planning tool and the lab tool.
- Set up once, not maintained weekly. Scope the structure once and the connections, the program Gantt, and the candidate rankings stay current on their own. The program's page is the status review, not a deck rebuilt for it every Friday.
- Start simple, add depth when you need it. A project scoped to a target is useful on day one; phases, scoring profiles, and dashboards are layers you add as a program matures, not a setup you finish first.
-
Transparent pricing. $175 per user per month, every module included. Planning isn't an enterprise upsell.
-
Founded in 2011, focused exclusively on biologics R&D. The programs/projects/targets structure was built for this industry's workflows, not retrofitted from a generic project management tool.
Manage your entire process, from discovery to lead characterization
With Affinity, it's never been easier to collaborate effectively on drug discovery and development. Spend more of your time on discovery instead of data entry by using one solution that provides all of the tools you'll need. Request a demo or free trial today.
Collaborate
Facilitate collaboration between discovery, production, and analytics teams
Integrate
Fully integrated, from target identification to lead characterization
Consolidate
Single source of truth for all assay data
Analyze
In-depth analysis of lead antibodies
Learn more about our solutions for Biologics R&D
-
Sequence Analysis
-
Phage Panning
-
Lead Characterization
-
Hybridoma Production
Sequence Analysis
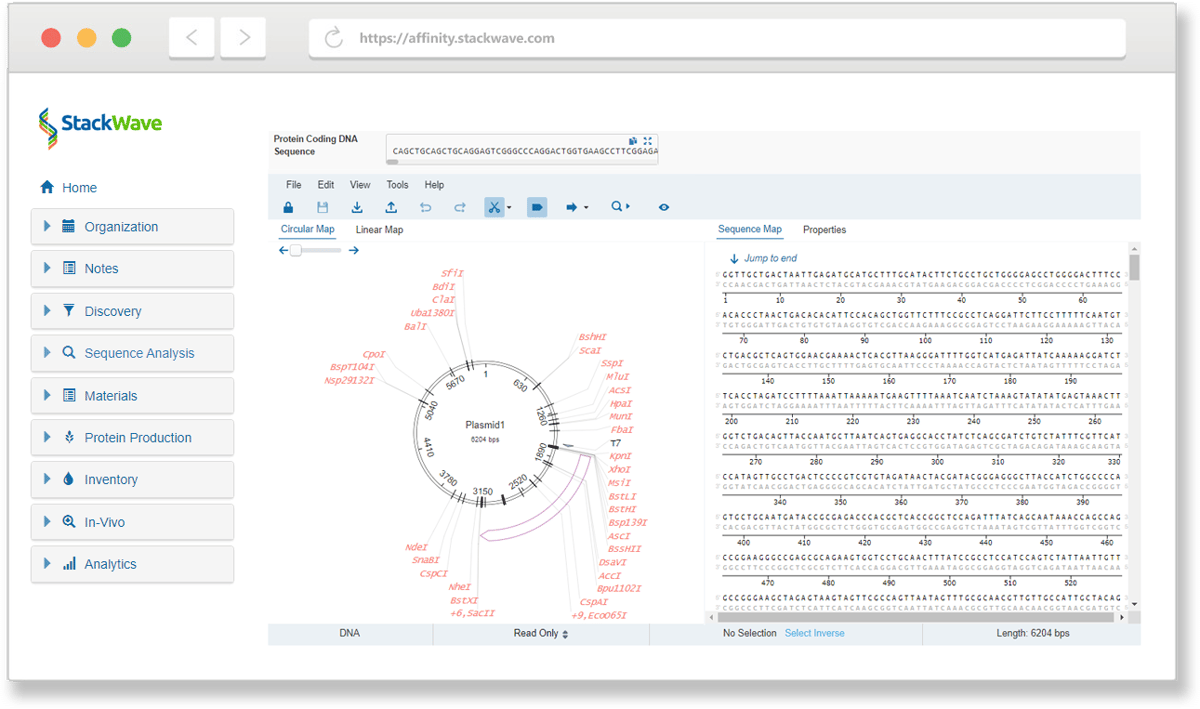
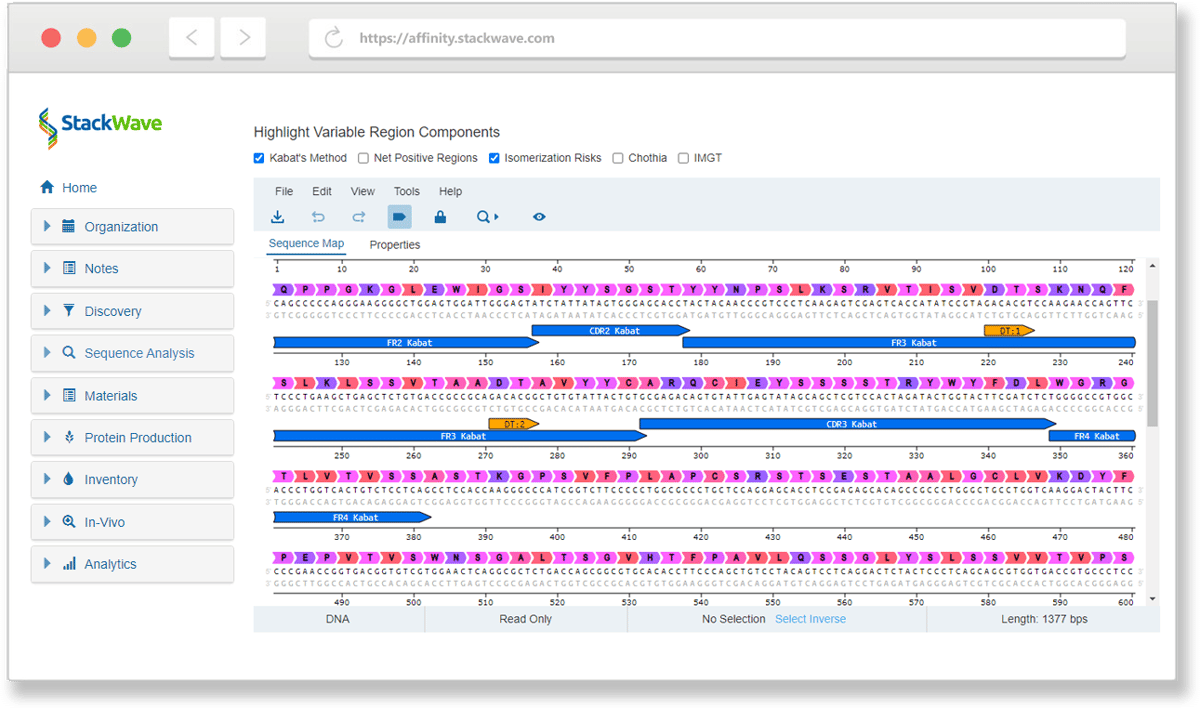
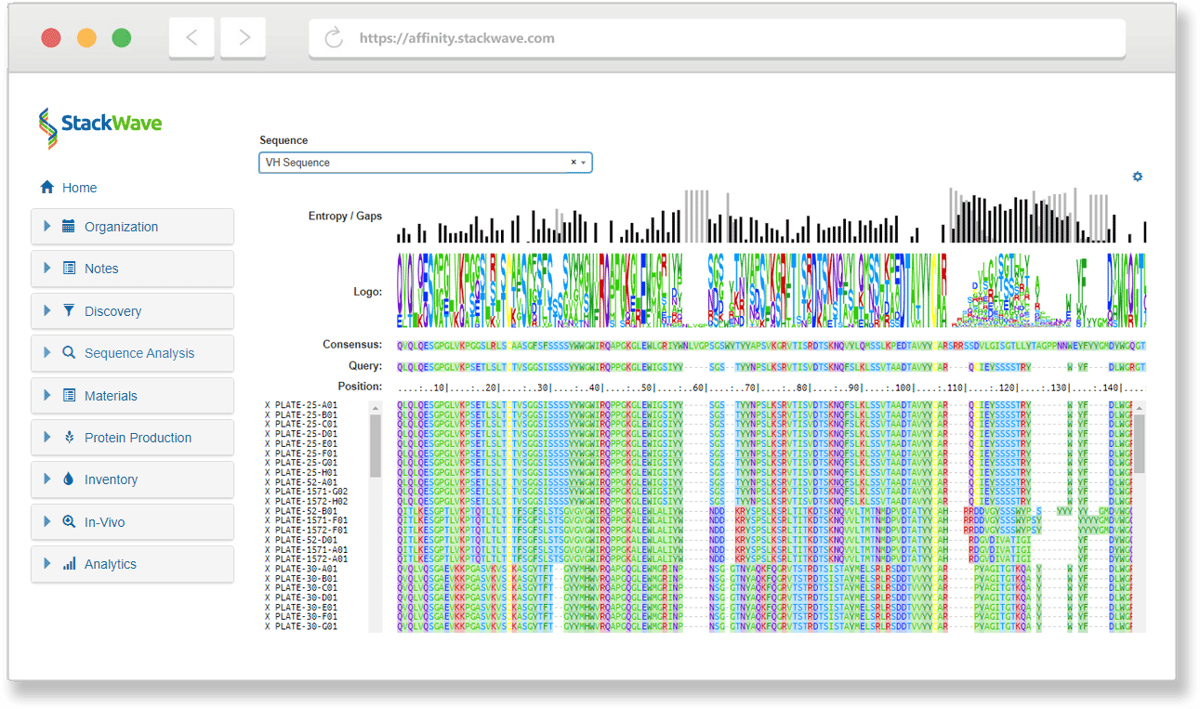
Leverage Affinity’s built-in sequence analysis tools to identify the unique antibodies in your discovery campaign results without having to license or build a separate bioinformatics system. Additional sequence search tools take advantage of Affinity’s sequence and variable region databases to quickly find related sequences.
Phage Panning
Phage panning allows you to narrow the enormous diversity represented by your phage libraries to a manageable set of antibodies for further study. Create visual designs of your phage panning experiment to track which combinations of antigens and other inputs produced the most promising leads. From the pools of phage output produced, generate sets of screening plates for assaying, sequencing, screening, and analysis.
Lead Characterization
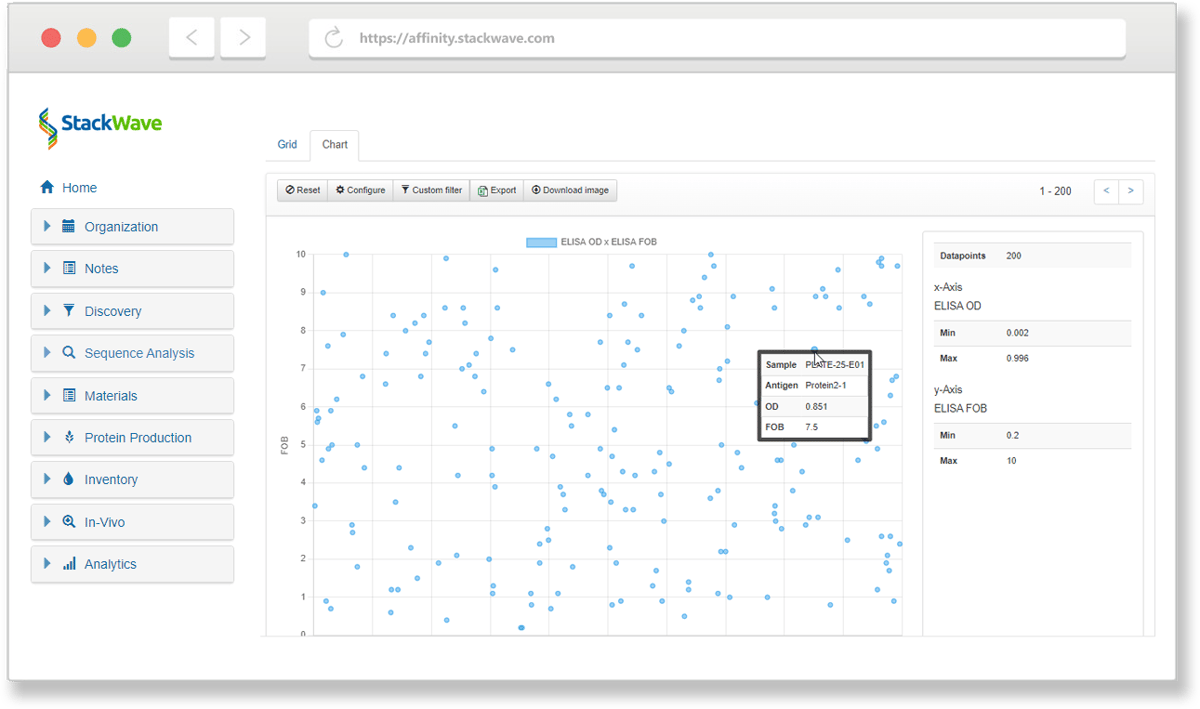
StackWave Affinity provides workflows for phage, hybridoma, and single B-cell campaigns, assay data management, sequence analysis, custom reporting, and plate generation in a single solution. These tools integrate seamlessly to help discovery teams quickly identify their most promising lead antibodies. Automation support for liquid handling platforms and assay data ingest allows for high-throughput screening of campaign results.
Hybridoma Production
Manage the complexity of hybridoma campaigns with an actual animal study management solution that connects seamlessly with hybridoma plate generation. Generated plates can be screened, sequenced, filtered, and lead antibodies identified using an intuitive set of tools that combine assay data management, sequence analysis, and custom reporting.
"StackWave gives us confidence in our leads by collecting all of the data about our potential therapeutics in one place and making that data actionable by allowing us to compare antibodies of interest."
"I worked with StackWave for ~4 years at my previous job to implement our LIMS. It was a great learning experience. We put in place an incredible system for our entire workflow, from plasmid registration to in-vivo study data registration."
"StackWave’s Platform allowed us to collaborate on our in-vivo studies in a web browser at home... I would highly recommend StackWave for therapeutic discovery teams looking to improve collaboration between teams."